Real Gases
Van der Waals Equation
When deriving the ideal gas equation and the kinetic theory of gases, it was implicitly assumed that the gas particles are infinitely small and that interactions between them can be neglected.
For
real gases, however, this is no longer the case.
Instead, the intrinsic volume of the gas particles must be subtracted from the total volume of the gas, since this is no longer available to the gas particles.
The volume $V$ in the ideal gas equation must therefore be replaced by the difference $V-nb$ for $n$ mol particles, where $b$ is a material constant of the gas to be determined experimentally.
In order to take into account the forces of attraction between the gas particles, we can assume that each particle in the gas volume under consideration exerts cohesive forces on the other gas particles.
%In the case of dipole molecules, these forces are permanently present due to the charge transfer, whereas such charge transfers can be induced by collisions in the case of non-polar gas particles.
%The resulting forces are also called Van der Waals forces.
The force acting on all gas particles must therefore be proportional to the square of their density and thus inversely proportional to the volume of the gas itself.
This reduces the gas pressure $p$ by the value $na/V^2$, which is called internal pressure or cohesion pressure.
$a$ is also a substance-specific quantity that has to be determined experimentally.
This leads to the following relation between $p$, $V$, and $T$ called Van der Waals equation.
Van der Waals Equation
The real gas equation has two additional parameters compared to the ideal gas equation: the substance-specific quantitity $a$ and the internal pressure $na/V^2$. It is usually written as follows:
\begin{equation}
\boxed{\left(p + \frac{na}{V^2}\right)(V-nb) = nRT}
\end{equation}
If you solve this equation for $p$, the pressure can be represented as a function of the volume for a fixed temperature.
This is shown as an example of $CO_2$ with the parameters taken from the literature.
For most gases, these parameters are well-known and have precisely been studied.
Maxwell Lines
The resulting plot shows that for large volumes and low pressures, the curve is almost identical to the ideal gas equation.
Below a certain volume, there is a reversal point and a drop in pressure, which turns into a stronger increase again at even smaller volumes.
However, these reversal points cannot be observed in nature, since the entire system is in an unstable state here.
Instead, a line, a so-called
Maxwell line must be drawn through the graph in such a way that the two resulting areas between the line and the graph are of equal size.
When you reach the right-hand intersection coming from large volumes, the gas begins to liquefy.
The pressure remains largely constant during this process until you finally reach the left intersection.
At this point, ideally, the entire gas volume has transitioned into the liquid phase.
The sharp rise in pressure at even smaller volumes is consistent with the observed incompressibility of liquids.
This page contains 593 words and 3552 characters.
Last modified: 2022-10-01 20:36:04 by mustafa
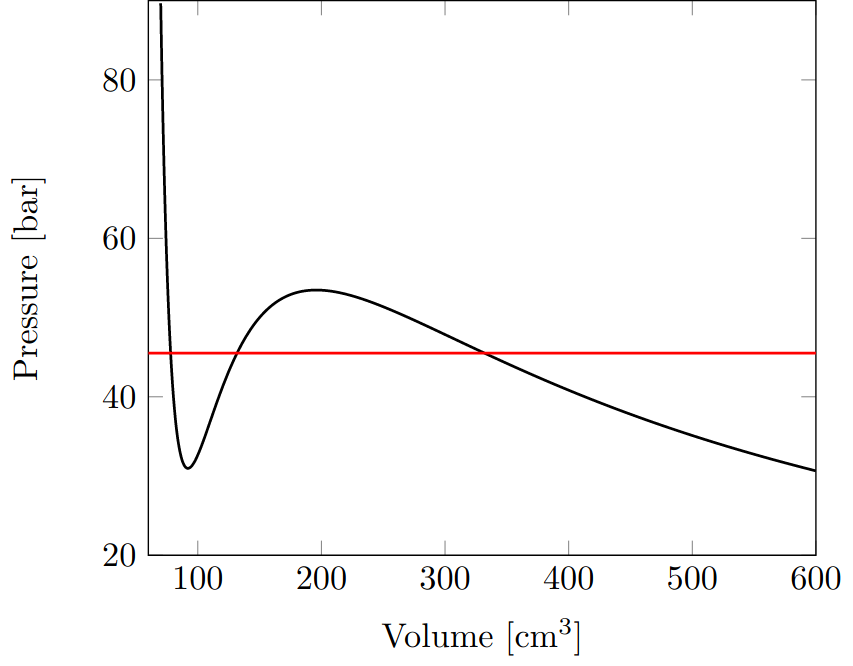 $p$-$V$ diagram using the parameters measured for $CO_2$

