First Graph
Table of Contents
Creating Graph
TGraph *gr = new TGraph();There are several ways to fill a graph. We can for example hand over data in form of float or double arrays. Let us define two arrays x and y in the following way:
double x[5] = {0,1,2,3,4};
double y[5] = {0,1,4,9,16};
In this case, we have to change the line according to
TGraph *gr = new TGraph(5, x, y);
Drawing Graph
void graph()
{
    double x[5] = {0,1,2,3,4};
    double y[5] = {0,1,4,9,16};

    TGraph *gr = new TGraph(5, x, y);

    TCanvas *c1 = new TCanvas();
    gr->Draw();
}
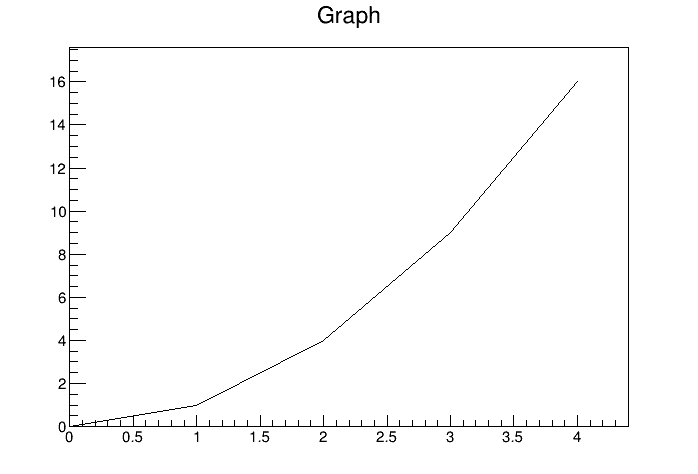 Our first graph.
Alternative Filling
void graph()
{
    TGraph *gr = new TGraph();

    gr->SetPoint(0, 0, 0);
    gr->SetPoint(1, 1, 1);
    gr->SetPoint(2, 2, 4);
    gr->SetPoint(3, 3, 9);
    gr->SetPoint(4, 4, 16);

    TCanvas *c1 = new TCanvas();
    gr->Draw();
}
After plotting this graph, we will find the exact same result as shown before.
Drawing Options
gr->Draw("AL")
The letter A stands for axis and always has to be inserted when drawing a new graph. The letter L is used for lines. If we want to draw a smooth curve through the given data points, we have to replace L with C for "curved". In addition, we can draw the points by inserting e.g. an asterisk * into the draw option string:
gr->Draw("AC*")
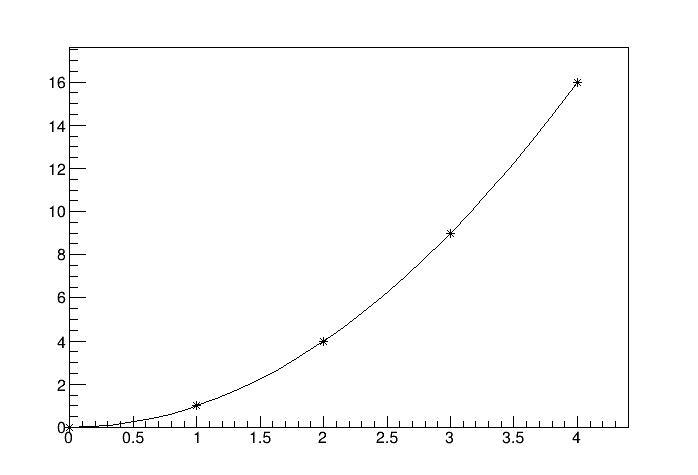 Graph with displayed data points and smooth curve.
 gr->Draw("AP");
and run your program, the points will not be visible. In order to fix this issue, you first have to define the marker style for your graph. This you can do with the member function of TGraph called SetMarkerStyle(). The size of the marker you can additionally change using the function SetMarkerSize(). The marker style has to be defined using an integer value, whereas the size can be fixed with a float value. Going back to our example before we can now use the following code
void graph()
{
    TGraph *gr = new TGraph();

    gr->SetPoint(0, 0, 0);
    gr->SetPoint(1, 1, 1);
    gr->SetPoint(2, 2, 4);
    gr->SetPoint(3, 3, 9);
    gr->SetPoint(4, 4, 16);

    gr->SetMarkerSize(1.5);
    gr->SetMarkerStyle(20);


    TCanvas *c1 = new TCanvas();
    gr->Draw("AP");
    c1->Print("root_graph_points.png");
}
to display a graph with bullets without any connections between the data points.
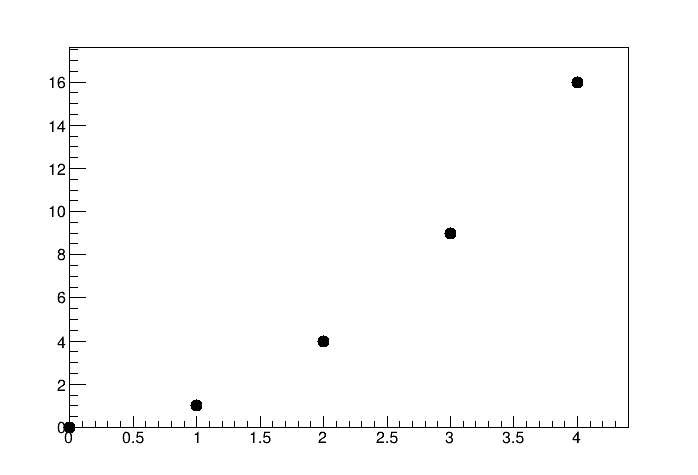 Graph with filled markers and without connections between data points.
This page contains 750 words and 4729 characters.


Last modified: 2022-10-01 18:30:19 by mustafa