First Histogram
Table of Contents
Preparation
void histogram()
{}
All code we present in this tutorial will be inserted into the place between the curly brackets.
Creating Histogram
TH1F hist();However, we prefer to create our histogram on the heap, i.e. we will have to write:
TH1F *hist = new TH1F();If we define our histogram without passing any arguments to the constructor, an empty histogram with 100 bins with the limits 0 and 1 is created. For most applications, this standard definition is not useful. We want to therefore create a new histogram using the following line of code:
TH1F *hist = new TH1F("hist", "Histogram", 100, 0, 100);
The first argument has to be a string and defines the name of the histogram. It will later be displayed inside the canvas. The second argument is the title of the histogram. The third argument defines the number of bins we want to create (in this case 100). And the last two arguments are used to define the limits.
For drawing the histogram, we first have to define a canvas in which the histogram will be displayed. We will do this again on the heap by writing
TCanvas *c1 = new TCanvas();Finally, we can draw our histogram:
hist->Draw();
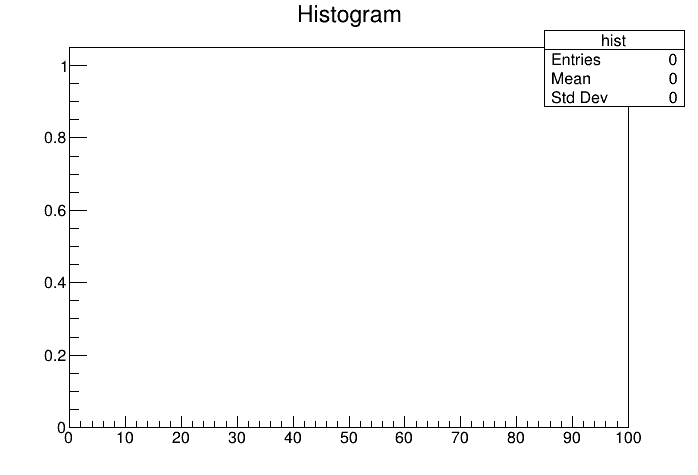 Our first empty histogram.
void histogram()
{
    TH1F *hist = new TH1F("hist", "Histogram", 100, -5, 5);
    TCanvas *c1 = new TCanvas();
    hist->Draw();
}
Filling Histogram
hist->Fill(5);If we draw our histogram now, we can see a bar appearing at the value 5. In addition, the mean value changes now from 0 from 5. And of course, the standard deviation is still 0.
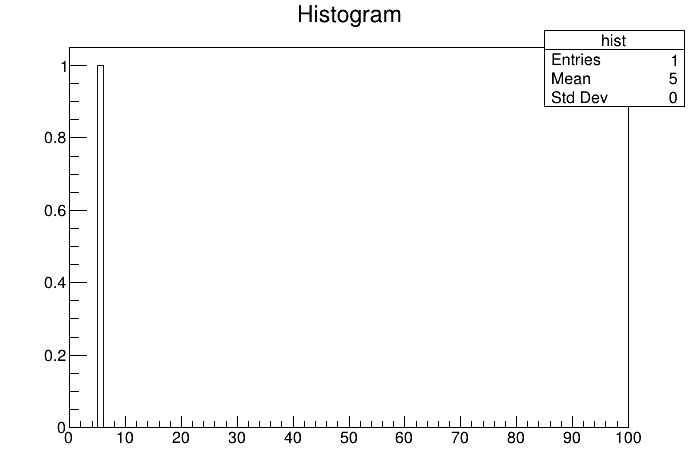 Histogram filled with one entry.
void histogram()
{
    TH1F *hist = new TH1F("hist", "Histogram", 100, -5, 5);
    TCanvas *c1 = new TCanvas();
    hist->Fill(5);
    hist->Draw();
}
In the next step, you can fill more values to the histogram to find out what will happen.This page contains 608 words and 3670 characters.


Last modified: 2022-10-01 18:30:08 by mustafa