Fonts & Styles
Table of Contents
Preparation
void styles()
{
    TCanvas *c1 = new TCanvas();

    TH1F *hist = new TH1F("hist", "Histogram", 100, -5, 5);
    hist->FillRandom("gaus");

    hist->Draw();
}
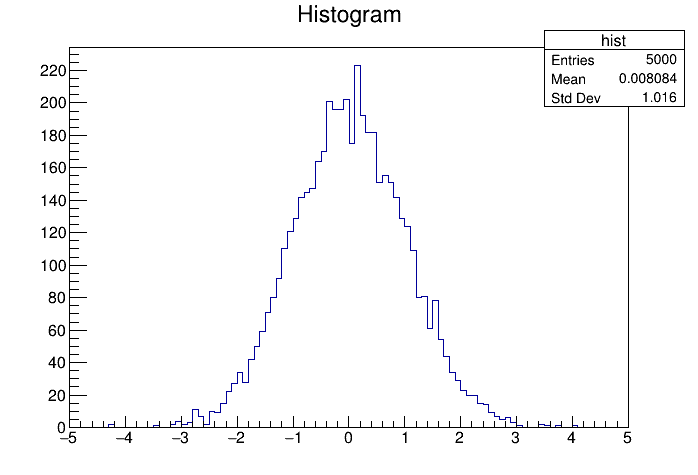 A simple histogram with 5000 entries following a Gaussian distribution.
hist->FillRandom("gaus", 100)
Now we want to overwrite the defined title "Histogram" by writing
hist->SetTitle("New Title")
And of course, you can also change the name from "hist" to any other name in the following way:
hist->SetName("new_name")
Axis Titles
hist->GetXaxis()->SetTitle("X Values")
hist->GetYaxis()->SetTitle("Y Values")
Or you can define the axis titles directly during the construction of your histogram:
TH1F *hist = new TH1F("hist", "Histogram;X Values;Y values", 100, -5, 5);
If you want to get rid of the Stat-Box in the upper right corner, you can simply write:
hist->SetStats(0);
Font Sizes
hist->GetXaxis()->SetLabelSize(0.05);
hist->GetXaxis()->SetTitleSize(0.05);
The standard size is 0.035. You can also replace X with Y, in order to modify the label and title size for your y-axis. However, you have to keep in mind that in this case, the histogram might exceed the limits of your Canvas.
Canvas Margins
c1->SetLeftMargin(0.15);This value is basically a percentage. Hence, a value of 0.15 means that the left border occupies 15% of your Canvas width. The standard value for all margins is 0.1. You can replace Left with Bottom, Top, or Right, depending on which side you want to modify.
Line Styles & Colors
hist->SetLineColor(kRed);
hist->SetLineWidth(2);
hist->SetLineStyle(kDashed);
hist->SetFillColor(kGreen);
The function SetLineColor() is used to change the color of line, whereas the line width can be varied using SetLineWidth(). The standard value here is 1. SetLineStyle is then used to change the style from the kSolid to kDashed which creates a dashed line. And at the end we use the function SetFillColor() to fill the area of our histogram below the line. Our code with all implemented changes will look now as follows:
void styles()
{
    TCanvas *c1 = new TCanvas();
    c1->SetLeftMargin(0.15);
    c1->SetBottomMargin(0.15);


    TH1F *hist = new TH1F("hist", "Histogram;X Values;Y Values", 100, -5, 5);

    hist->FillRandom("gaus");
    hist->SetStats(0);

    hist->GetXaxis()->SetLabelSize(0.05);
    hist->GetXaxis()->SetTitleSize(0.05);
    hist->GetYaxis()->SetLabelSize(0.05);
    hist->GetYaxis()->SetTitleSize(0.05);

    hist->SetLineColor(kRed);
    hist->SetLineWidth(2);
    hist->SetLineStyle(kDashed);
    hist->SetFillColor(kGreen);

    hist->Draw();
}
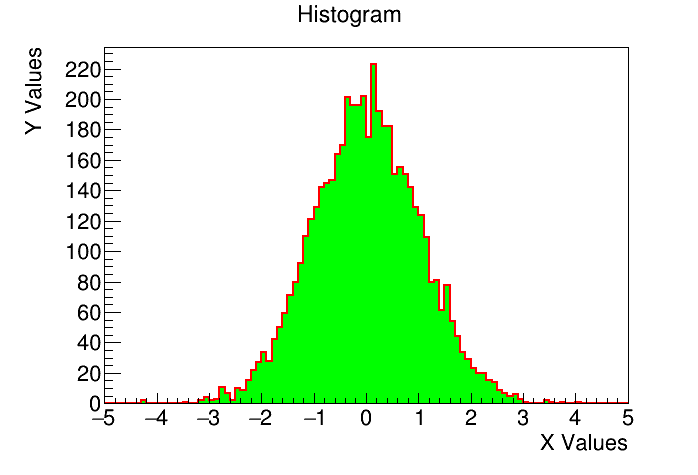 The final result after adjusting different colors and fonts.
This page contains 766 words and 4887 characters.


Last modified: 2022-10-08 21:05:03 by mustafa