Random Values
Table of Contents
Uniform Distribution
TRandom2 *r = new TRandom2();Now we can create a uniform distribution by using the function Rndm():
double rval = r->Rndm();This function returns a value between 0 and 1 which will then be stored in the double variable rval. The full program then looks like that
 void randomize()
{
    TRandom2 *r = new TRandom2();
    double rval = r->Rndm();
    cout << rval << endl;
}
Now we observe, that whenever we run the program, the value 0.186915 is given out in the terminal. The reason for this can be found in the fact that in the standard configuration, TRandom2 uses a fixed seed. If we change the first for instance to
TRandom2 *r = new TRandom2(2);then the output value looks different but is still constant whenever we start the program. If we want to avoid this, we can set a random seed with the following code line:
TRandom2 *r = new TRandom2(0);
Gaussian Distributions
void randomize()
{
    TRandom2 *r = new TRandom2(0);
    TH1F *hist = new TH1F("hist", "Histogram", 100, -5, 5);
    for(int i = 0; i < 1000; i++)
    {
        double rval = r->Gaus(0., 0.5);
        hist->Fill(rval);
    }
    TCanvas *c1 = new TCanvas();
    hist->Draw();
}
The result is a nice-looking Gaussian centered around 0.
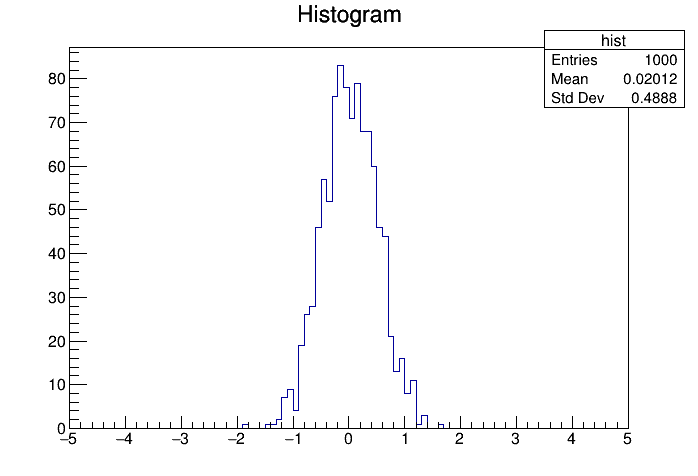 Filling randomly created numbers from a Gaussian distribution into a histogram.
This page contains 430 words and 2770 characters.


Last modified: 2022-10-01 18:30:25 by mustafa